 ParrotPal
ParrotPal Data · short read
The 1,800-calorie paradox: same calories, same maths, different scale
Key findings
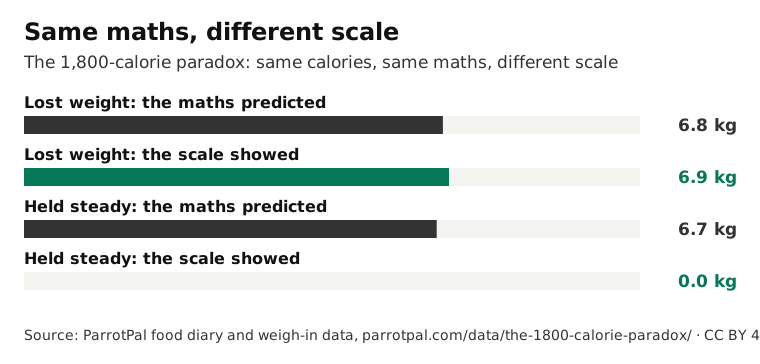
Among ParrotPal members logging about 1,800 kcal a day, those who lost weight lost about 6.9 kg, as the energy maths predicted, while those whose weight held steady should have lost about 6.7 kg but changed by 0.0 kg, February to August 2026. Their scale suggests about 425 kcal a day the diary didn’t show. Source: ParrotPal anonymised food diaries and weigh-ins.
Members who logged about 1,800 kcal a day and lost weight dropped about 6.9 kg, almost exactly what the energy maths predicted from their food logs (6.8 kg). Members logging the same amount whose weight held steady should, by the same maths, have lost about 6.7 kg over a typical 26 weeks. Their weight didn’t move (0.0 kg).
6.7 kgthe maths predicted the steady group would lose; the scale showed 0.0 kg
Same maths, different scale
Median, 1,800 bandMeasured against each member’s estimated maintenance, the calories their body would use at their weight, the group that lost weight logged a median 77% of maintenance and the steady group 83%. Both logged well below maintenance, at about 1,780 and 1,790 kcal a day. Only one group’s scale agreed: 0.49 kg a week down, against 0.03 kg a week up.
Across every intake level, half (50%) of the members whose weight held steady logged under 80% of their estimated maintenance: about 240 people, at a median 68%. Over a typical 24 weeks, that should have meant about 14 kg lost. Their median change was 0.0 kg. The 80% line alone doesn’t separate the groups, though: 67% of members who lost weight also logged under it. What separates them is whether the scale followed.
In calories, the steady group’s scale suggests about 425 kcal a day more than they logged, roughly 19% of their intake (13% to 29%, depending on the activity level assumed), against about 4% for the group that lost weight. About 180 kcal of the 550 kcal a day between the two groups is body size: the group that lost weight was heavier, and bigger bodies use more energy.
Their logging habits looked almost the same: food on 91% and 88% of days, Fridays to Sundays on 88% and 85%, and oil, butter or a sauce on 53% and 48% of days. If calories go unrecorded, portions, cooking fats and bites are more likely than whole missed days.
This is consistent with research. In the OPEN study, which measured energy use with doubly labelled water, men reported 12–14% fewer calories than they used on 24-hour recalls and 31–36% fewer on food questionnaires; women 16–20% and 34–38% (Subar and colleagues, 2003). In a 1992 study of people who said they couldn’t lose weight on under 1,200 kcal a day, reported intake was 47% below their actual intake, and their metabolism was not lower than expected (Lichtman and colleagues, New England Journal of Medicine).
Our data can’t separate under-logging from lower energy use. Maintenance equations are usually within 10% of measured resting metabolism but can be further off for one person, and metabolism adapts by roughly 10–15% after weight loss. So this describes groups, never any one person.
What this means
If you log carefully and the scale won’t move, you’re in good company, and the usual suspects are portions, cooking oil, sauces and bites. Weighing food now and then is the simplest check.
What the research says
Measured against doubly labelled water, adults under-reported energy on 24-hour recalls and by more on food questionnaires.
Subar AF, Kipnis V, Troiano RP, et al. (2003). Using intake biomarkers to evaluate the extent of dietary misreporting in a large sample of adults: the OPEN study. American Journal of Epidemiology 158(1):1–13. doi:10.1093/aje/kwg092
People who said they couldn’t lose weight on very low intakes under-reported their intake by about half, and their metabolism was normal.
Lichtman SW, Pisarska K, Berman ER, et al. (1992). Discrepancy between self-reported and actual caloric intake and exercise in obese subjects. New England Journal of Medicine 327(27):1893–8. doi:10.1056/NEJM199212313272701
The energy in a kilo of weight change depends on body fat, so the familiar 7,700 kcal per kilo is only a rough rule.
Hall KD. (2008). What is the required energy deficit per unit weight loss?. International Journal of Obesity 32(3):573–6. doi:10.1038/sj.ijo.0803720
Research describes other groups of people; our figures are what ParrotPal members logged.
The figures
| Members logging 1,600 to 2,000 kcal a day (activity factor 1.4) | Weight lost, median |
|---|---|
| Lost weight: the maths predicted | 6.8 kg |
| Lost weight: the scale showed | 6.9 kg |
| Held steady: the maths predicted | 6.7 kg |
| Held steady: the scale showed | 0.0 kg |
| Activity factor | Logged, % of maintenance | Weight the maths predicted they’d lose | Weight change on the scale |
|---|---|---|---|
| 1.3 | 89% | 3.7 kg | 0.0 kg |
| 1.4 | 83% | 6.7 kg | 0.0 kg |
| 1.5 | 77% | 9.8 kg | 0.0 kg |
Method in brief. ParrotPal members in every country (more than 1,100) with 3 or more weigh-in days spanning at least 28 days and food logged on 70% or more of the days in between, 1 February to 31 August 2026; deleted entries don’t count. The 1,800 band is members logging 1,600 to 2,000 kcal a day: about 150 lost 0.25 kg a week or more, about 170 held steady or gained. Maintenance is the Mifflin-St Jeor equation × 1.4 for light activity (1.3 and 1.5 in the table; the calorie gap uses 1.3 to 1.6). Predicted change = (logged − maintenance) × days ÷ the energy in a kilo of body weight for that member (Hall, 2008). Height is estimated for about two-thirds of members, and logged calories cover logged days only.
Aggregates only: every group shown has 50 or more members and no share rests on fewer than 10. Patterns in what members logged, not causes. who’s counted · the 50/10 rule · logged isn’t eaten · the implied-intake model.
Questions people ask
Why am I not losing weight on 1,800 calories?
Among our members logging about 1,800 kcal a day, the ones whose weight held steady logged almost exactly what the ones who lost weight did. Their scale suggests calories the diary didn’t show, consistent with research on under-reporting, but our data can’t separate that from lower energy use. It isn’t advice for any one person.
Cite this
Free to use with credit and a link to the source page. The figures and chart are licensed CC BY 4.0.
Credit line
Source: ParrotPal food diary and weigh-in data, parrotpal.com/data/the-1800-calorie-paradox/
Citation
ParrotPal (2026). The 1,800-calorie paradox: same calories, same maths, different scale. ParrotPal Data. https://parrotpal.com/data/the-1800-calorie-paradox/. Licensed CC BY 4.0.
Embed the chart (an image with the credit link)
<figure><img src="https://parrotpal.com/data/the-1800-calorie-paradox/chart.svg" alt="Same maths, different scale: chart by ParrotPal" width="760" style="max-width:100%;height:auto" /><figcaption>Source: <a href="https://parrotpal.com/data/the-1800-calorie-paradox/">ParrotPal food diary and weigh-in data</a> (CC BY 4.0)</figcaption></figure>
Download the chart (SVG) · The figures (CSV)
Press questions, a comment or a chart in your house style: the ParrotPal team, jacqui+press@parrotpal.com. All our data pages: ParrotPal Data.
Track your own numbers in ParrotPal: 4.7★ on the App Store · iPhone. Get it on the App Store
Please read. This page reports patterns in anonymised, aggregated app data. It’s general information, not medical or dietary advice.