 ParrotPal
ParrotPal Data · the food diary report
What Britain logs
Not what we buy, and not what we tell surveys: what more than 8,500 UK members actually wrote down in their ParrotPal food diaries, February to August 2026. Foods, supermarkets, brands, takeaways, drinks, treats and the clock, ranked by how many people logged them.
Key findings
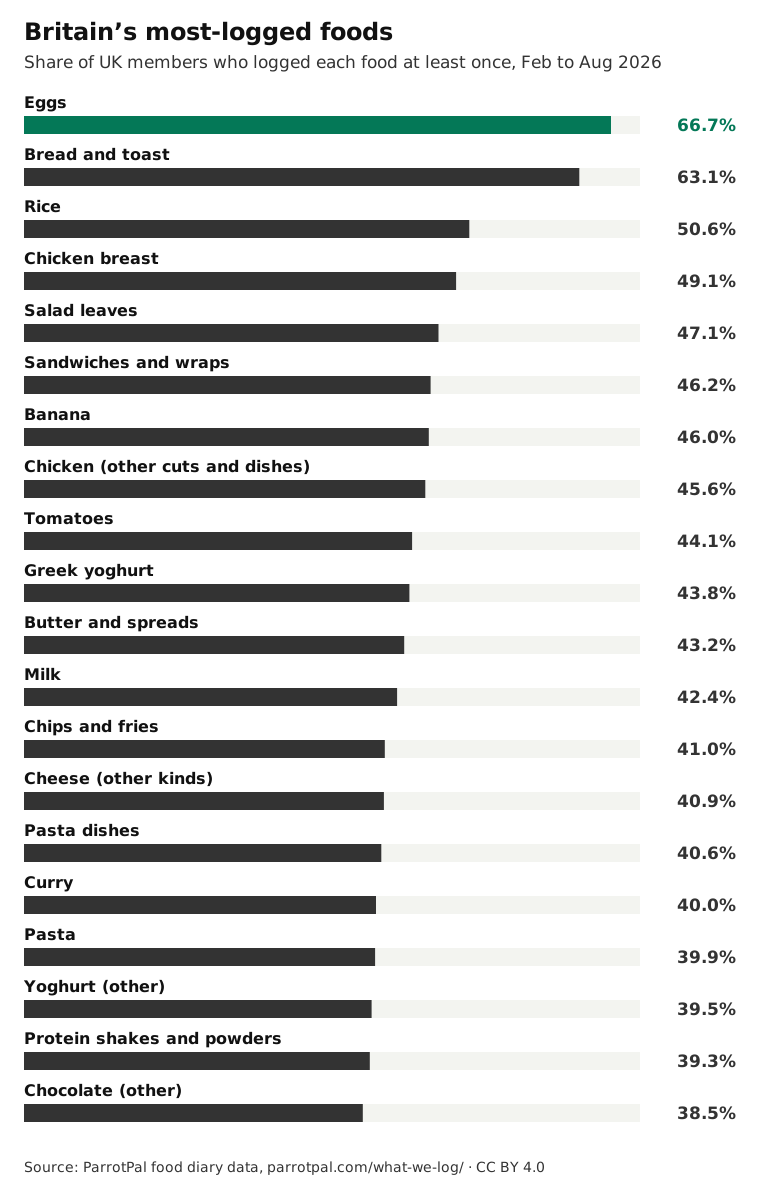
- Eggs are the most-logged food in UK food diaries: 66.7% of members logged them at least once, ahead of bread and toast (63.1%) and rice (50.6%).
- Coffee beats tea. 51.3% of members logged a coffee, against 28.2% who logged tea. Latte is the most-named order (20.7%).
- McDonald's is the most-logged takeaway chain: 19.9% of members logged it, ahead of Costa Coffee (10.3%), Starbucks (10.2%) and Greggs (10.1%).
- Myprotein on weekdays, Warburtons at the weekend. Myprotein is the brand the most branded loggers logged on every day from Monday to Friday; on Saturdays and Sundays it's Warburtons (14.6% of Saturday's branded loggers).
- Saturday, not Friday, is the drinks day. Alcohol appeared on 22.0% of logged Saturdays, 18.0% of Fridays and 6.7% of Mondays.
- Tesco own label reaches the most diaries (31.3% of members logged at least one Tesco own-label item). At Aldi the top own-label food is greek yoghurt.
- KitKat is the most-logged named chocolate bar (9.2% of members), ahead of Cadbury Dairy Milk (8.6%). Diet or zero-sugar cola was logged by 17.2% of members, about twice regular cola (8.5%).
- Five a day is rare on the record. Only 11.5% of fully logged days included 5 or more different fruits and vegetables. Dinner carried 41.4% of the day’s logged calories.
Britain’s 50 most-logged foods
Ranked by people, not entries: each food’s share is the share of UK members who logged it at least once between February and August 2026. Pick a time of day, a group or a food category, or search the whole list (every food logged by 50 or more members).
Most-logged foods
Share of members| # | Food | Bar | Members | How many |
|---|---|---|---|---|
| 1 | EggsEggs | 66.7% | 5,000+ | |
| 2 | Bread and toastBread and bakery | 63.1% | 5,000+ | |
| 3 | RiceRice, pasta and grains | 50.6% | 4,000+ | |
| 4 | Chicken breastMeat and poultry | 49.1% | 4,000+ | |
| 5 | Salad leavesVegetables and salad | 47.1% | 4,000+ | |
| 6 | Sandwiches and wrapsMeals and dishes | 46.2% | 4,000+ | |
| 7 | BananaFruit | 46.0% | 4,000+ | |
| 8 | Chicken (other cuts and dishes)Meat and poultry | 45.6% | 4,000+ | |
| 9 | TomatoesVegetables and salad | 44.1% | 3,000+ | |
| 10 | Greek yoghurtYoghurt | 43.8% | 3,000+ | |
| 11 | Butter and spreadsDairy and cheese | 43.2% | 3,000+ | |
| 12 | MilkDairy and cheese | 42.4% | 3,000+ | |
| 13 | Chips and friesPotatoes and chips | 41.0% | 3,000+ | |
| 14 | Cheese (other kinds)Dairy and cheese | 40.9% | 3,000+ | |
| 15 | Pasta dishesMeals and dishes | 40.6% | 3,000+ | |
| 16 | CurryMeals and dishes | 40.0% | 3,000+ | |
| 17 | PastaRice, pasta and grains | 39.9% | 3,000+ | |
| 18 | Yoghurt (other)Yoghurt | 39.5% | 3,000+ | |
| 19 | Protein shakes and powdersProtein products | 39.3% | 3,000+ | |
| 20 | Chocolate (other)Snacks and treats | 38.5% | 3,000+ | |
| 21 | Other sauces and condimentsSauces, spreads and oils | 38.5% | 3,000+ | |
| 22 | PeppersVegetables and salad | 37.0% | 3,000+ | |
| 23 | SausagesMeat and poultry | 36.7% | 3,000+ | |
| 24 | Biscuits and cookies (other)Snacks and treats | 36.3% | 3,000+ | |
| 25 | Noodle dishes and stir friesMeals and dishes | 36.3% | 3,000+ | |
| 26 | Porridge and oatsBreakfast cereal and oats | 35.5% | 3,000+ | |
| 27 | BroccoliVegetables and salad | 35.3% | 3,000+ | |
| 28 | CucumberVegetables and salad | 35.1% | 3,000+ | |
| 29 | Crisps (other brands)Snacks and treats | 35.0% | 3,000+ | |
| 30 | CheddarDairy and cheese | 34.0% | 3,000+ | |
| 31 | OnionsVegetables and salad | 34.0% | 3,000+ | |
| 32 | Crackers, rice cakes and crispbreadsSnacks and treats | 33.7% | 3,000+ | |
| 33 | MayonnaiseSauces, spreads and oils | 33.7% | 3,000+ | |
| 34 | BurgersMeals and dishes | 33.3% | 2,500+ | |
| 35 | SourdoughBread and bakery | 33.2% | 2,500+ | |
| 36 | AppleFruit | 32.7% | 2,500+ | |
| 37 | Chicken nuggets, wings and fried chickenMeals and dishes | 32.5% | 2,500+ | |
| 38 | StrawberriesFruit | 32.3% | 2,500+ | |
| 39 | Pitta, naan and flatbreadsBread and bakery | 32.1% | 2,500+ | |
| 40 | BlueberriesFruit | 31.9% | 2,500+ | |
| 41 | CarrotsVegetables and salad | 31.7% | 2,500+ | |
| 42 | AvocadoFruit | 31.4% | 2,500+ | |
| 43 | Ice cream and lolliesSnacks and treats | 31.2% | 2,500+ | |
| 44 | Wraps and tortillasBread and bakery | 30.6% | 2,500+ | |
| 45 | BaconMeat and poultry | 30.1% | 2,500+ | |
| 46 | Peanut and nut butterSauces, spreads and oils | 29.9% | 2,500+ | |
| 47 | Salad dressingsSauces, spreads and oils | 29.9% | 2,500+ | |
| 48 | PizzaMeals and dishes | 29.8% | 2,500+ | |
| 49 | Ham and cooked meatsMeat and poultry | 29.5% | 2,500+ | |
| 50 | SalmonFish and seafood | 29.1% | 2,500+ |
Group: more than 8,500 UK members who kept a food diary. “Members” is the share who logged the food at least once; “How many” is a rounded floor.
Source: ParrotPal, parrotpal.com/what-we-log/ · CC BY 4.0
Time of day is when the item was logged (UK time), which is usually, but not always, when it was eaten. Breakfast is 5am to 11am, lunch 11am to 3pm, afternoon 3pm to 5pm, dinner 5pm to 10pm, late evening 10pm to 5am.
What each supermarket’s own label puts in the diary
Own label means the supermarket’s own brands and sub-brands (Brooklea and Cowbelle at Aldi, Milbona at Lidl, Finest at Tesco, Taste the Difference at Sainsbury’s and so on). Shares are of the members who logged at least one own-label item from that store. Only foods and products logged by 50 or more members are shown, so the smaller stores have shorter lists.
- Tesco31.3%
- Aldi22.0%
- M&S21.4%
- Sainsbury's20.4%
- Asda16.3%
- Lidl13.6%
- Morrisons11.5%
- Co-op11.2%
- Waitrose8.4%
- Iceland3.6%
Share of UK members who logged at least one own-label item from each store.
Own label at Tesco
Share of its own-label loggers31.3% of UK members logged a Tesco own-label item (more than 2,500 members).
Most-logged own-label foods
- Sandwiches and wraps17.4%
- Bread and toast12.6%
- Chicken breast11.8%
- Eggs11.0%
- Ham and cooked meats10.8%
- Wraps and tortillas10.1%
- Chicken (other cuts and dishes)9.5%
- Pasta9.1%
- Greek yoghurt8.4%
- Steak7.7%
Most-logged named products
- Medium eggs4.6%
- Blueberries4.3%
- Plain tortilla wraps4.2%
- Raspberries3.5%
- Semi-skimmed milk3.5%
- 0% fat greek yoghurt3.4%
- Cooked ham2.5%
- Egg protein pot2.4%
- Juicy pineapple chunks2.3%
- Strawberries2.2%
Top categories
- Meals and dishes42.4%
- Meat and poultry36.1%
- Bread and bakery26.8%
- Snacks and treats26.7%
- Fruit25.2%
- Vegetables and salad25.0%
Source: ParrotPal, parrotpal.com/what-we-log/ · CC BY 4.0
Protein league for the same stores: Supermarket Protein Wars. One store at a time: Tesco’s most-logged own-label foods and each supermarket’s favourite.
The brands in Britain’s diaries, day by day
Brands here are everything that isn’t supermarket own label. Shares are of members who logged at least one branded item (55.7% of all members). Warburtons tops the year; pick a day to see how the order changes.
Most-logged brands
Every day- Warburtons20.2%
- Myprotein18.6%
- Arla16.9%
- Cadbury16.5%
- Walkers13.2%
- Heinz11.1%
- Grenade10.6%
- Graham's10.4%
- UFIT10.0%
- Fage9.1%
- Huel8.8%
- Danone8.7%
- Jason's Sourdough8.4%
- Müller8.4%
- The Gym Kitchen8.0%
- Pret A Manger7.5%
- Nestlé7.2%
- Village Bakery6.9%
- Kellogg's6.8%
- Birds Eye6.4%
- Trek6.1%
- Hovis6.0%
- For Goodness Shakes5.8%
- Starbucks5.8%
- Propercorn5.7%
Share of members who logged any brand that day · Source: ParrotPal, parrotpal.com/what-we-log/ · CC BY 4.0
Weekend-leaning brands. Saturday and Sunday make up 20.8% of the days members logged a brand. These brands lean furthest into the weekend (brands logged by 200 or more members):
- Hovis24.8%
- Warburtons25.0%
- Jason's Sourdough24.0%
- McCoy's23.6%
- Cadbury22.6%
- McVitie's22.3%
The high street in the diary
Chains are matched on the brand of a database item or the name in a voice or text log (“Greggs sausage roll”). 45.2% of members logged at least one chain item.
Most-logged chains
Share of members- McDonald's19.9%
- Costa Coffee10.3%
- Starbucks10.2%
- Greggs10.1%
- Nando's8.9%
- Pret A Manger7.3%
- KFC6.5%
- Itsu5.2%
- Subway4.4%
- Domino's4.0%
- Caffè Nero3.2%
- PizzaExpress2.9%
- Wagamama2.8%
- Wasabi2.5%
- YO! Sushi2.4%
Source: ParrotPal, parrotpal.com/what-we-log/ · CC BY 4.0
What members logged there
Share of the chain’s loggers- Burgers57.1%
- Chips and fries32.4%
- Sandwiches and wraps29.5%
- Chicken nuggets, wings and fried chicken23.6%
- Ice cream and lollies14.7%
- Chicken (other cuts and dishes)13.7%
- Noodle dishes and stir fries12.6%
- Ramyeon mcshaker fries - medium12.5%
Food types and named products logged by 50+ members · Source: ParrotPal, parrotpal.com/what-we-log/ · CC BY 4.0
Coffee, tea, wine and the diet-cola habit
Coffee vs tea
Share of membersCoffee was on 27.7% of fully logged days and tea on 9.9%. Tea is often logged less than coffee because a black tea has almost no calories, so treat this as what members chose to record.
Coffee vs tea by age
- 18–24: coffee34.2%
- 25–34: coffee50.6%
- 35–44: coffee53.0%
- 45–54: coffee52.3%
- 55+: coffee54.4%
- 18–24: tea15.9%
- 25–34: tea24.9%
- 35–44: tea29.0%
- 45–54: tea30.9%
- 55+: tea35.0%
Source: ParrotPal, parrotpal.com/what-we-log/ · CC BY 4.0
The coffee order
Share of coffee loggers- Coffee (type not given)54.0%
- Latte40.5%
- Iced coffee26.1%
- Flat white23.6%
- Cappuccino19.6%
- Black or filter coffee19.3%
- Espresso, cortado and macchiato14.3%
- Americano9.1%
- Instant coffee7.6%
- Mocha7.1%
Source: ParrotPal, parrotpal.com/what-we-log/ · CC BY 4.0
Most-logged alcoholic drinks
Share of members- Beer and lager17.3%
- White wine9.5%
- Red wine9.4%
- Gin6.6%
- Cider5.4%
- Rosé wine5.4%
- Alcohol-free beer and drinks5.3%
- Other cocktails5.3%
- Prosecco5.3%
- Wine (type not given)4.9%
- Guinness and stout4.5%
- Ale and IPA3.8%
Source: ParrotPal, parrotpal.com/what-we-log/ · CC BY 4.0
Days with alcohol logged
Share of logged days- Monday6.7%
- Tuesday7.8%
- Wednesday9.6%
- Thursday11.2%
- Friday18.0%
- Saturday22.0%
- Sunday14.9%
Source: ParrotPal, parrotpal.com/what-we-log/ · CC BY 4.0
Alcohol appeared on 12.2% of all fully logged days. Food diaries are known to under-record drink, so these are floors.
Soft drinks
Share of members- Fruit juice and smoothies23.1%
- Other fizzy drinks and squash19.1%
- Diet or zero cola17.2%
- Cola8.5%
- Energy drinks8.3%
- Diet or zero fizzy drinks and squash6.7%
- Milkshake6.7%
- Kombucha1.8%
Source: ParrotPal, parrotpal.com/what-we-log/ · CC BY 4.0
Tea and other hot drinks
Share of members- Tea25.5%
- Hot chocolate7.9%
- Matcha7.3%
- Herbal and fruit tea5.1%
- Chai latte3.5%
- Green tea2.1%
Source: ParrotPal, parrotpal.com/what-we-log/ · CC BY 4.0
Bananas lead the fruit bowl; five a day is rare on the record
Most-logged fruit
Share of members- Banana46.0%
- Apple32.7%
- Strawberries32.3%
- Blueberries31.9%
- Avocado31.4%
- Raspberries23.2%
- Grapes20.2%
- Mixed berries15.8%
- Satsumas and clementines15.5%
- Mango15.3%
Source: ParrotPal, parrotpal.com/what-we-log/ · CC BY 4.0
Most-logged vegetables
Share of members- Salad leaves47.1%
- Tomatoes44.1%
- Peppers37.0%
- Broccoli35.3%
- Cucumber35.1%
- Onions34.0%
- Carrots31.7%
- Baked beans27.5%
- Peas27.2%
- Mixed vegetables25.7%
Source: ParrotPal, parrotpal.com/what-we-log/ · CC BY 4.0
We counted the different fruits and vegetables on each fully logged day (3 or more items, 800 to 6,000 kcal). Only 11.5% of days had 5 or more, 32.1% had 3 or more, and 26.0% had none. The typical day had 1.
Per member (7 or more full days): 3.9% reached 5 on most of their days and 62.4% at least once.
How we count five a day. Each different fruit or vegetable counts once a day, whatever the amount. Potatoes don’t count; juice and smoothies count once; beans and pulses count once; dried fruit counts once. The diary doesn’t record 80 g portions reliably, so this is variety, not the official portion count. Mixed dishes (a curry, a salad bowl) count as no fruit or veg, so the true figure is higher.
Dinner carries the day
On fully logged days, dinner (logged between 5pm and 10pm) held 41.4% of the day’s logged calories and was the biggest meal on 46.5% of days. Lunch was biggest on 26.2%, breakfast on 10.0%.
Share of the day’s logged calories
All logged days- Breakfast13.8%
- Lunch26.4%
- Afternoon10.3%
- Dinner41.4%
- Late evening8.1%
Source: ParrotPal, parrotpal.com/what-we-log/ · CC BY 4.0
Typical calories logged
When that meal is logged- Breakfast430 kcal
- Lunch660 kcal
- Afternoon460 kcal
- Dinner880 kcal
- Late evening600 kcal
Source: ParrotPal, parrotpal.com/what-we-log/ · CC BY 4.0
The typical fully logged day came to 1,660 kcal: 1,620 on a Monday and 1,740 on a Saturday. More in the weekend effect.
Breakfast favourites
Share of members- Eggs53.8%
- Bread and toast45.8%
- Banana37.4%
- Milk36.6%
- Greek yoghurt35.9%
- Porridge and oats32.4%
- Protein shakes and powders31.1%
- Butter and spreads28.7%
Source: ParrotPal, parrotpal.com/what-we-log/ · CC BY 4.0
Dinner favourites
Share of members- Bread and toast50.8%
- Rice50.0%
- Eggs48.9%
- Chicken breast46.9%
- Salad leaves43.0%
- Chicken (other cuts and dishes)41.4%
- Chips and fries40.0%
- Tomatoes38.5%
Source: ParrotPal, parrotpal.com/what-we-log/ · CC BY 4.0
KitKat, Walkers and a digestive
53.6% of members logged chocolate, 46.1% crisps, 42.9% biscuits and 31.2% ice cream or a lolly. A treat appeared on 57.9% of logged days, from 56.6% of Mondays to 60.7% of Sundays.
Named chocolate
Share of members- KitKat9.2%
- Cadbury Dairy Milk8.6%
- Lindt8.1%
- Maltesers6.1%
- Mini Eggs6.0%
- Creme Egg5.9%
- Galaxy5.7%
- Kinder4.9%
- Twix4.8%
- Twirl4.3%
- Easter eggs3.8%
- Snickers3.7%
Source: ParrotPal, parrotpal.com/what-we-log/ · CC BY 4.0
Crisps
Share of members- Walkers22.9%
- Skips, Frazzles, Mini Cheddars and other KP snacks8.9%
- Hula Hoops7.2%
- McCoy's5.4%
- Prawn cocktail crisps5.4%
- Pringles4.7%
- Kettle Chips and Tyrrells2.5%
Source: ParrotPal, parrotpal.com/what-we-log/ · CC BY 4.0
Biscuits
Share of members- Digestives12.2%
- Shortbread9.2%
- Biscoff7.8%
- Custard creams4.8%
- Oreo4.1%
- Jaffa Cakes3.8%
- Hobnobs3.2%
Source: ParrotPal, parrotpal.com/what-we-log/ · CC BY 4.0
Days with a treat
Share of logged days- Monday56.6%
- Tuesday57.7%
- Wednesday57.4%
- Thursday57.6%
- Friday57.6%
- Saturday59.1%
- Sunday60.7%
Source: ParrotPal, parrotpal.com/what-we-log/ · CC BY 4.0
“Walkers” includes its sister snacks logged under the Walkers name or brand (Quavers, Wotsits, Monster Munch, Doritos). Seasonal chocolate is in the seasons chart.
From Creme Eggs to ice cream: the diary by month
Each month’s share of members who logged the item at least once, out of members who logged anything that month (from more than 2,500 in August to more than 4,000 in February).
By month, 2026
Share of that month’s members| February | 16.6% |
|---|---|
| March | 18.4% |
| April | 21.6% |
| May | 28.1% |
| June | 29.4% |
| July | 32.1% |
| August | 27.0% |
Source: ParrotPal, parrotpal.com/what-we-log/ · CC BY 4.0
Ice cream went from 16.6% of members in February to 32.1% in July. Mini Eggs peaked at 6.1% in March, and soup fell from 23.9% in February to 9.3% in July.
Months are different mixes of members (fewer members logged in summer), so read the shape, not small steps.
The weekend has a menu: Yorkshire puddings and prosecco
Saturdays and Sundays make up 23.7% of the days members logged anything. Foods far above that line belong to the weekend; foods far below it belong to the working week.
Weekend foods
Weekend share of its logging days- Yorkshire pudding67.7%
- Black pudding47.0%
- Roast potatoes46.8%
- Prosecco44.1%
- Gravy44.0%
- Cider41.3%
- Lamb40.7%
- Other cocktails39.0%
- Brussels sprouts38.5%
- Wine (type not given)38.4%
Source: ParrotPal, parrotpal.com/what-we-log/ · CC BY 4.0
Working-week foods
Weekend share of its logging days- Satsumas and clementines15.2%
- Butter beans15.3%
- Couscous, quinoa and other grains15.4%
- Tuna15.9%
- Pasta15.8%
- Edamame and soya beans16.0%
- Beef mince16.2%
- Apple16.3%
- Cheese snacks (Babybel and similar)16.5%
- Chilli con carne16.9%
Source: ParrotPal, parrotpal.com/what-we-log/ · CC BY 4.0
Rosé and matcha; Guinness and energy drinks
How many times more likely one sex was than the other to log each item at least once (items logged by 50 or more women and 50 or more men).
Most women-leaning
Times as likely- Rosé wine3.6×
- Matcha2.6×
- Flax and linseed2.3×
- Gin2.2×
- White wine2.2×
- Chai latte2.1×
- Herbal and fruit tea2.1×
- Wine (type not given)2.0×
Source: ParrotPal, parrotpal.com/what-we-log/ · CC BY 4.0
Most men-leaning
Times as likely- Guinness and stout4.1×
- Ale and IPA2.9×
- Energy drinks2.4×
- Scotch egg2.1×
- Alcohol-free beer and drinks1.9×
- Black pudding1.8×
- Whisky1.8×
- Beer and lager1.8×
Source: ParrotPal, parrotpal.com/what-we-log/ · CC BY 4.0
For example, 7.8% of men logged Guinness or stout, against 1.9% of women.
Where the protein comes from, and how it’s logged
Most-logged food categories
Share of members- Snacks and treats79.0%
- Meals and dishes78.9%
- Bread and bakery76.1%
- Meat and poultry75.6%
- Vegetables and salad75.5%
- Dairy and cheese74.9%
- Fruit74.6%
- Sauces, spreads and oils73.1%
- Eggs66.9%
- Yoghurt60.9%
- Rice, pasta and grains60.8%
- Potatoes and chips58.8%
Source: ParrotPal, parrotpal.com/what-we-log/ · CC BY 4.0
Share of all logged protein
By category- Meat and poultry22.1%
- Meals and dishes17.9%
- Protein products7.5%
- Bread and bakery5.6%
- Eggs5.1%
- Snacks and treats5.1%
- Fish and seafood5.1%
- Yoghurt5.0%
- Dairy and cheese4.9%
- Vegetables and salad3.2%
Source: ParrotPal, parrotpal.com/what-we-log/ · CC BY 4.0
Meat and poultry supplied 22.1% of all the protein members logged; protein shakes, powders and bars 7.5%. Fruit was 13.6% of logged fibre and vegetables 15.7%.
Matched to the food database
Share of items- Protein products29.7%
- Supplements28.1%
- Yoghurt27.4%
- Snacks and treats19.5%
- Soft drinks and juice19.2%
- Bread and bakery18.5%
- Breakfast cereal and oats14.8%
- Meals and dishes13.9%
Source: ParrotPal, parrotpal.com/what-we-log/ · CC BY 4.0
Across all items, 12.5% were matched to a food-database entry (a barcode scan or a search), and the rest were written by ParrotPal’s AI from a voice note, a message or a photo. Packaged foods (protein products, supplements, yoghurt) lean on the database; fresh food is mostly spoken or typed. The data we hold doesn’t separate voice from photo from text, so we can’t split those three.
How this report was made
- Who
- UK ParrotPal members (more than 8,500): members whose app is set to UK time, with internal and test accounts left out.
- When
- Food logged from 1 February to 31 August 2026 (UK time). Deleted diary entries don’t count.
- Ranked by people
- Every league counts members: the share of a group who logged an item at least once. Every item shown was logged by 50 or more members, every group shown has at least 50 people, and no share rests on fewer than 10 people. Group sizes are rounded floors (“more than 2,500”).
- Naming foods
- Members log by voice, text, photo or barcode, so the same food appears under many names. A dictionary of about 300 food types groups them (“banana”, “bananas” and “1 medium banana” are all Banana). Names it can’t place are left out of the leagues. Brand and supermarket names are as logged; own label follows the ParrotPal Data definition.
- Days
- Day-level figures use fully logged days: 3 or more items and 800 to 6,000 kcal on a UK calendar day. Meals are the time an item was logged.
- Patterns, not causes
- These are patterns in what members logged. Logging isn’t eating, and members aren’t a random sample of the UK. For what the diary misses, see the 1,800-calorie paradox.
- Checks
- Every figure comes from saved, read-only queries; the page is built by a script from the rounded results, and a separate check script re-derives every number before publication. Full method: ParrotPal Data methodology.
Questions people ask
What is the most-logged food in the UK?
In ParrotPal members’ food diaries, eggs: 66.7% of UK members logged eggs at least once between February and August 2026, ahead of bread and toast (63.1%) and rice (50.6%). Banana is the most-logged fruit (46.0%).
Do Brits log more coffee or tea?
Coffee. 51.3% of members logged a coffee and 28.2% logged tea. Tea with no milk has almost no calories, so it’s probably logged less often than it’s drunk.
What is the most-logged takeaway?
McDonald’s, logged by 19.9% of members.
Is this what people eat?
It’s what members logged. People log less than they eat, and some foods (drinks, snacks, treats) are under-logged more than others. App members aren’t a random sample of the UK.
Why rank by members, not entries?
One person logging the same yoghurt every day would otherwise outweigh a hundred people who logged it once. Counting people shows how widely a food is eaten across the diaries.
Can I use these figures?
Yes. Everything on this page is licensed CC BY 4.0: free to use with credit and a link to parrotpal.com/what-we-log/. The figures are in the CSV below.
Cite this
Free to use with credit and a link to the source page. The figures and chart are licensed CC BY 4.0.
Credit line
Source: ParrotPal food diary data, parrotpal.com/what-we-log/
Citation
ParrotPal (2026). What Britain logs. ParrotPal Data. https://parrotpal.com/what-we-log/. Licensed CC BY 4.0.
Embed the chart (an image with the credit link)
<figure><img src="https://parrotpal.com/what-we-log/chart.svg" alt="Britain’s most-logged foods: chart by ParrotPal" width="760" style="max-width:100%;height:auto" /><figcaption>Source: <a href="https://parrotpal.com/what-we-log/">ParrotPal food diary data</a> (CC BY 4.0)</figcaption></figure>
Download the chart (SVG) · The figures (CSV)
Press questions, a comment or a chart in your house style: the ParrotPal team, jacqui+press@parrotpal.com. All our data pages: ParrotPal Data.
Curious what your own diary says? Log by voice, photo or barcode in ParrotPal. Get it on the App Store
Please read. This report describes patterns in anonymised, aggregated app data. It’s general information, not medical or dietary advice. Brand, chain and supermarket names are trademarks of their owners. ParrotPal isn’t affiliated with any of them, and none paid or was asked to appear.